
What is NDVI?
NDVI (Normalized Difference Vegetation Index) is a widely used vegetation index that quantifies the presence and health of vegetation using remote sensing data. It serves as a simple numerical indicator to assess the density and condition of plant life in a specific area.
How is it calculated?
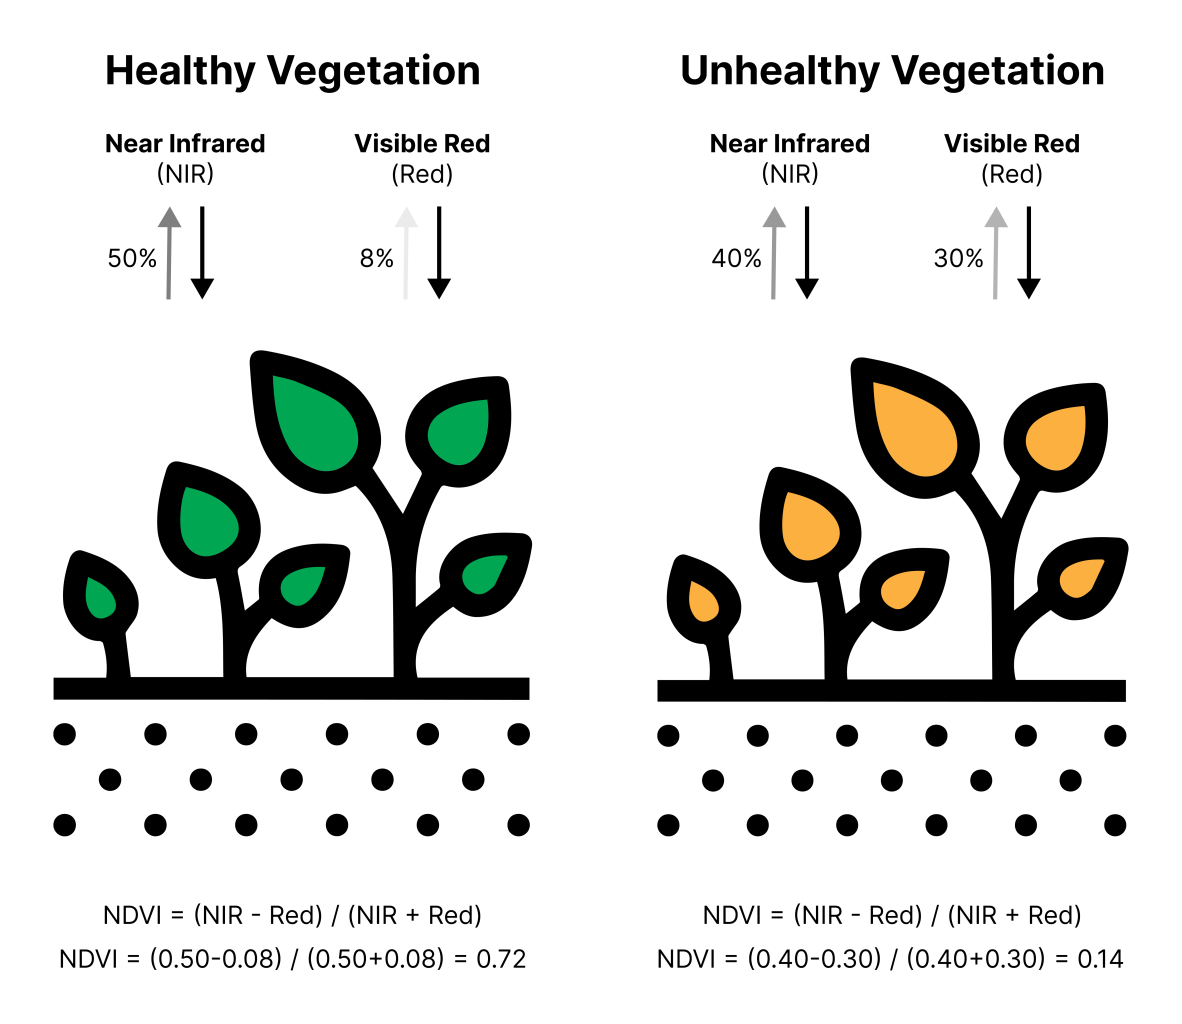
NDVI is calculated using two bands of light reflected by vegetation: the red and near-infrared (NIR) bands. The formula for NDVI is (NIR - Red) / (NIR + Red), where NIR represents the amount of light reflected in the near-infrared band, and Red represents the amount of light reflected in the red band. The resulting value ranges from -1 to 1, with higher values indicating healthier and denser vegetation.
The reason why the red and near-infrared (NIR) bands are used to calculate NDVI has to do with the unique properties of plant leaves and how they interact with light.
In the visible spectrum, chlorophyll within plant leaves strongly absorbs light in the red band (around 600-700 nm) for use in photosynthesis. As a result, relatively little red light is reflected back from healthy, green vegetation. This is why healthy plants often appear green to our eyes—the green light is not absorbed as strongly as red light, and it is reflected back to our eyes.
In contrast, the near-infrared (NIR) band (around 700-1300 nm) behaves differently. Plant leaves have a cellular structure that causes them to strongly reflect light in the NIR band. This reflection is due to the spongy mesophyll layer in the leaf, which scatters light in the NIR wavelengths. The NIR reflection is not related to photosynthesis, and it is a characteristic feature of healthy plant tissue.
Why does NDVI matter?
NDVI is essential because it offers valuable insights into the health and abundance of vegetation in a particular area. It can be used to monitor changes in vegetation over time, such as variations in plant growth due to climate change, deforestation, or land use practices. Additionally, NDVI can help estimate crop yields, assess the impact of natural disasters on vegetation, and guide land management decisions.
NDVI is also a critical variable in ecological and environmental research, providing a reliable way to quantify vegetation cover and dynamics on a large scale. In summary, NDVI is a vital tool for understanding and monitoring vegetation health, with numerous applications in agriculture, forestry, and ecology.
How is it interpreted?
The NDVI value ranges from -1 to 1. Generally, the interpretation of NDVI values is as follows:
- Values close to -1 indicate water bodies or non-vegetated surfaces.
- Values close to 0 represent bare soil, urban areas, or very sparse vegetation.
- Values between 0.1 and 0.4 indicate areas with low to moderate vegetation density.
- Values above 0.4 suggest regions with dense and healthy vegetation.
Streambatch API NDVI Data
The Streambatch API provides high-resolution, daily NDVI data globally by fusing Landsat, Sentinel-2, and MODIS satellite imagery. This fusion of data from multiple sources allows for a more accurate and reliable representation of vegetation health and dynamics across the world.
By accessing the NDVI data through the Streambatch API, users can benefit from the high temporal resolution and extensive coverage provided by this unique dataset. The availability of daily NDVI data enables more precise monitoring of vegetation dynamics, supporting a wide range of applications in agriculture, forestry, ecology, and environmental research.